Homeownership is the best way to build wealth
Historically, homeownership has been one of the most powerful drivers of wealth in America—today, the average homeowner’s net worth is about $430,000, compared to just $10,000* for renters.
Homeowners vs. renters (median Net worth)
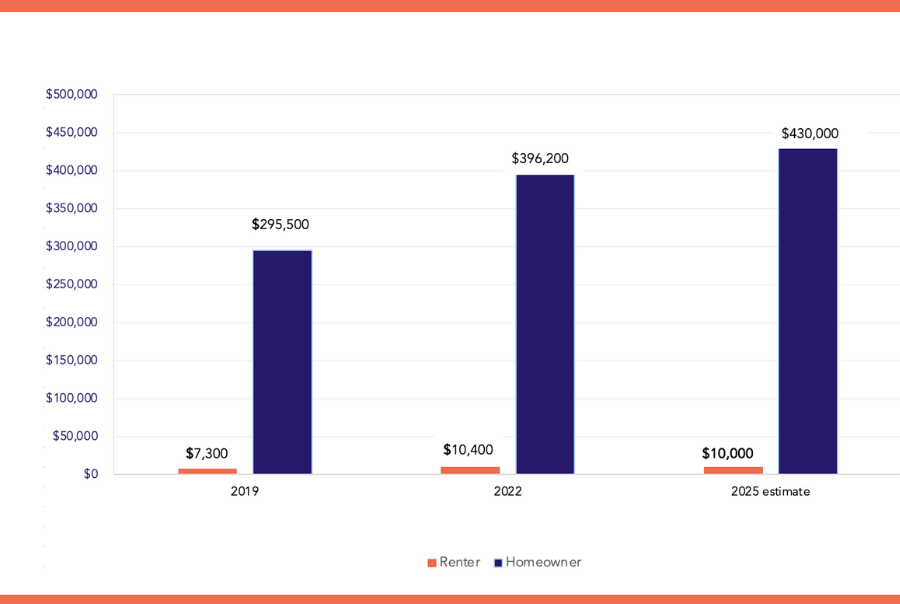
Sources: *Federal Reserve Survey of Consumer Finance, National Association of Realtors
A persistent homeownership gap
While homeownership remains a sign of prosperity, for much of the 20th century, government policies and lending practices shaped who had access to homeownership—and who didn’t.
From the establishment of the 30-year mortgage, with redlining* risk maps, in 1934 to the implementation of the GI Bill and federal loan programs, barriers were built into the very systems meant to promote stability and growth. These barriers, along with other factors such as unequal access to credit and limited housing choices, have resulted in a persistent homeownership gap.
*The Merriam-Webster dictionary defines redlining as the illegal practice of refusing to offer credit or insurance in a particular community on a discriminatory basis (as because of the race or ethnicity of its residents).
NATIONWIDE
IN GREATER ROCHESTER
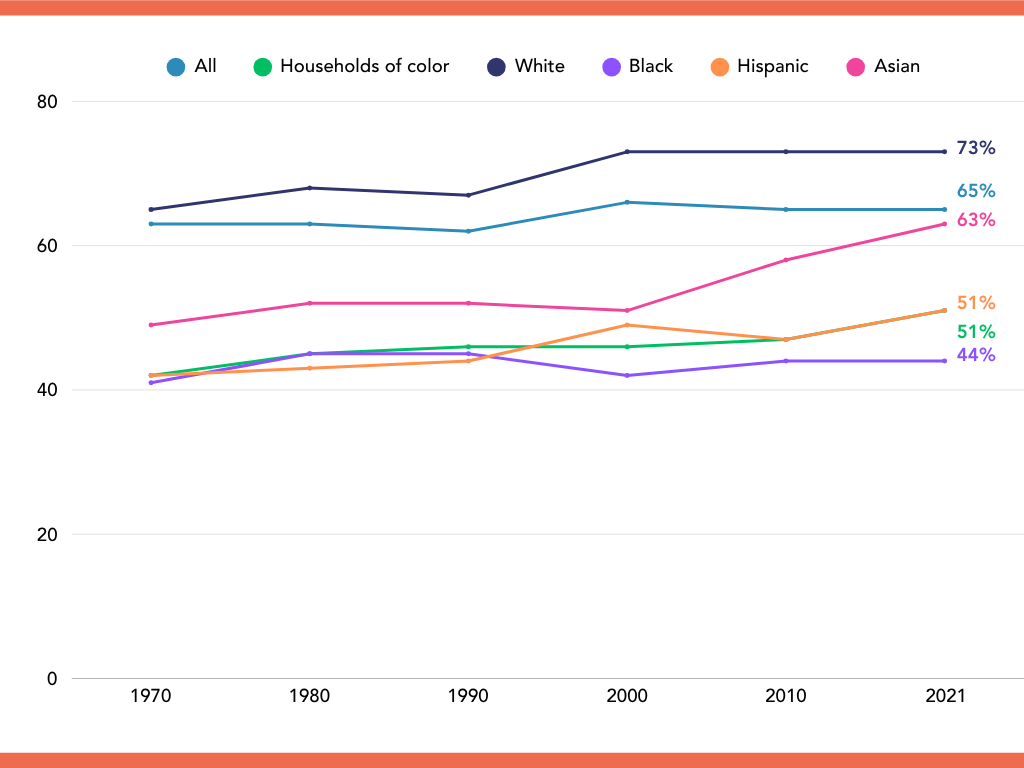
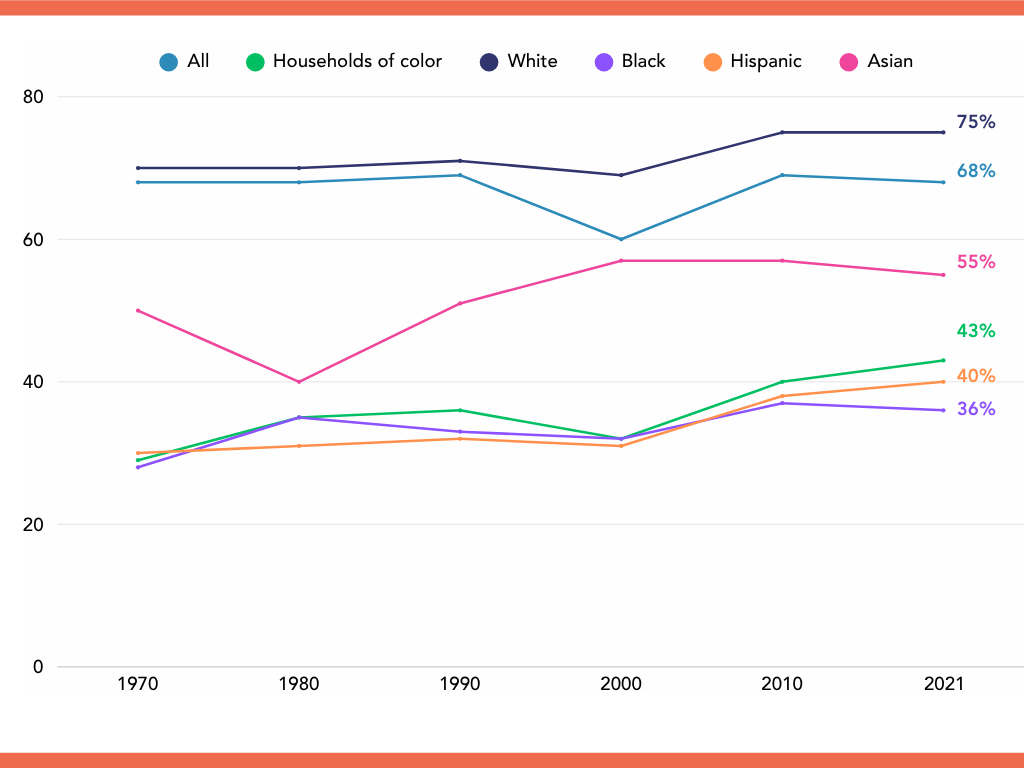
Source: Urban Institute, Market and Disparity Data Analysis Toolkit
IT’S NOT A POVERTY ISSUE
The gap persists even when controlling for income and education, meaning that qualified, financially stable households are still less likely to own a home. Historic barriers to favorable mortgage terms, generational wealth transfers, and desirable neighborhoods created a compounding disadvantage. Today, rising home prices, disparities in home assessments, and unequal access to credit keep the gap alive—regardless of a family’s financial readiness.
Homeownership rates by income relative to the Area Median Income (AMI) nationwide
Homeownership rates by education level nationwide
White
- 80% AMI 60%
- 80%-120% AMI 74%
- 120% AMI 85%
- High School or Less 70%
- College Degree 77%
Black
- 80% AMI 32%
- 80%-120% AMI 51%
- 120% AMI 69%
- High School or Less 38%
- College Degree 56%
Hispanic
- 80% AMI 37%
- 80%-120% AMI 51%
- 120% AMI 70%
- High School or Less 47%
- College Degree 49%
Asian
- 80% AMI 45%
- 80%-120% AMI 57%
- 120% AMI 74%
- High School or Less 58%
- College Degree 65%
Source: Urban Institute, 2019
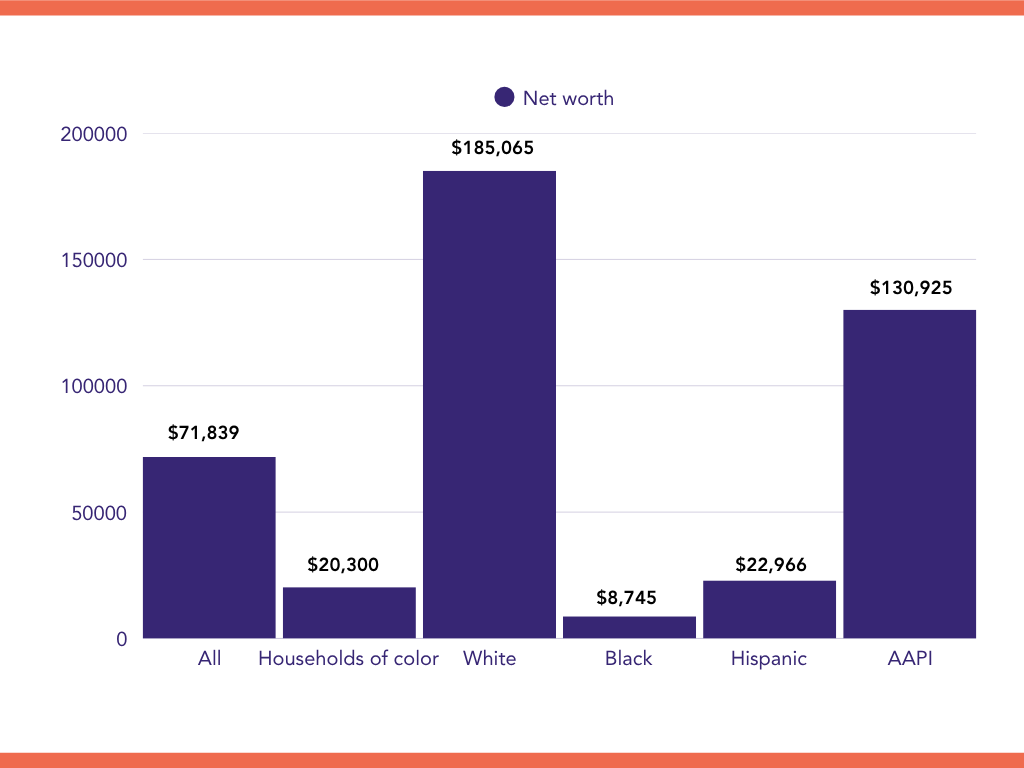
IMPACT ON HOUSEHOLD NET WORTH
When families are unable to access homeownership, they miss out on building an investment, gaining stability, and passing wealth to the next generation.
NATIONWIDE
IN GREATER ROCHESTER
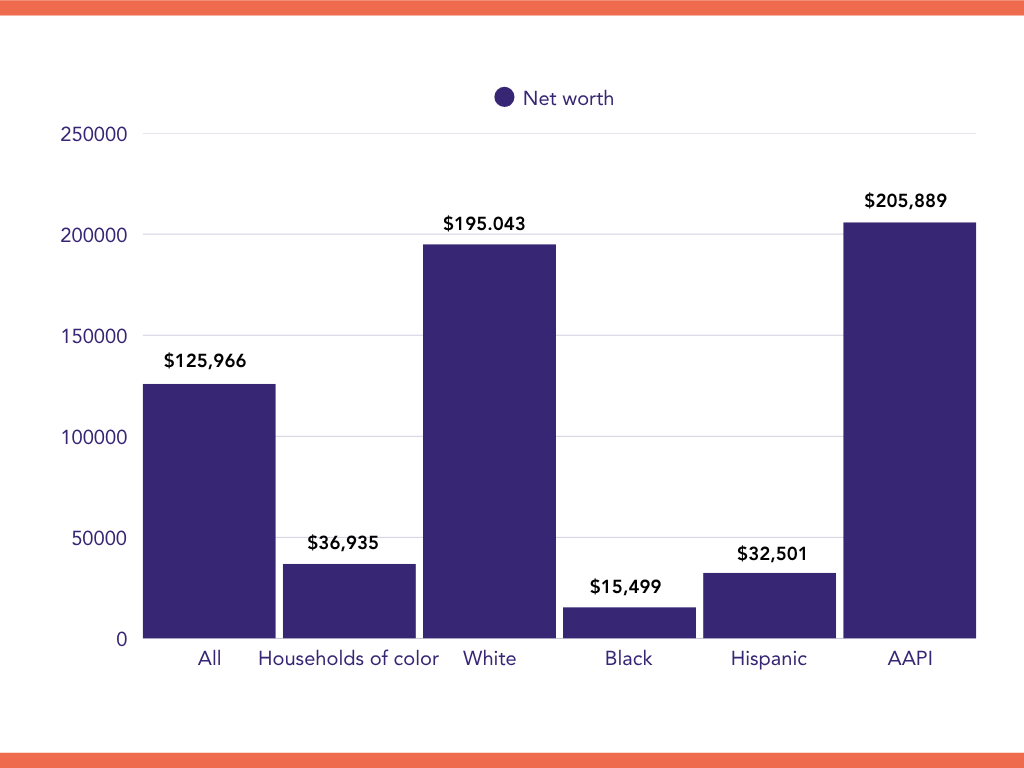
Note: AAPI = Asian American and Pacific Islander
Sources: Urban Institute, Market and Disparity Data Analysis Toolkit
we asked local renters about their challenges around homeownership. Their stories call for change:
With the right support, more families can attain homeownership.
“When my husband and I started talking about buying a house – we had no guide, no information. People told us you can call the city, but we didn’t know who to call.”
“The first house I put in an offer for, got sold before I could get pre-qualified and the last couple of them went for above asking – more than I would have been able to pay.”
CHANGE REQUIRES RECOGNITION, BELIEF AND COmmitment
The persistence of the homeownership gap makes it hard for some families to build wealth over generations. Our vision is to create a Greater Rochester where homeownership is accessible to all and our entire community can thrive. Collaboration is important to reach this future, but is not the only thing we need to do. To learn more about what change could look like, visit our Vision page.